Building a full end-to-end, cloud-native alerting pipeline

Last Updated: July 14, 2025
- Catch issues early: Alerting empowers teams to detect anomalies (like rising error rates or resource exhaustion; before downtime impacts customers).
- Reduce noise, increase signal: With over-alerting often causing “alert fatigue,” integrating tools such as Prometheus and Alertmanager helps you apply silencing, grouping, and routing logic effectively.
- Enable rapid response: Pushing alerts through channels like Slack, PagerDuty, or via webhooks ensures your on-call team gets notified with context fast.
- Scale confidently: As your infrastructure scales out or shifts, having alert pipelines that are declaratively managed (e.g. via IaC or GitOps) prevents configuration drift.
These foundational capabilities convert metrics and logs into actionable warnings, minimizing downtime and giving reliability teams a fighting chance.
In this deep dive you will build a full end-to-end, cloud-native alerting pipeline on WSL Ubuntu. We start by installing and configuring Prometheus and Alertmanager, then route alerts to webhook receivers. You will learn how to:
- Set up a unified workspace for monitoring tools
- Install and configure Alertmanager with routing and inhibition rules
- Install Prometheus and define custom alerting rules
- Launch both services and observe alerts flowing through the pipeline
- Trigger and resolve test alerts to verify your configuration
- You have a compatible Linux environment (WSL Ubuntu or similar).
- Note: WSL gives you a full Linux shell that works just like a native Ubuntu machine, so you’ll install and run Prometheus, Alertmanager, exporters, and Ansible playbooks there. If you prefer an EC2 Ubuntu free-tier box, the steps are nearly identical (just omit the WSL install)
- You have
wget,tar,nano, and basic shell tools installed.- Install basic tools if missing:
sudo apt update && sudo apt install -y wget tar nano - If you already have these tools, you’re good to go.
- Install basic tools if missing:
- Ports 9090 and 9093 are available on localhost.
- A free account at webhook.site to capture HTTP posts
- Familiarity with basic Linux file operations and shell commands
- Visit https://webhook.site in your browser.
- Copy the unique URL it generates (it looks like
https://webhook.site/<YOUR_ID>). - That endpoint will collect any POST requests you send, so you can inspect payloads.
mkdir -p ~/monitoring
cd ~/monitoring
This keeps your setup organized and makes cleanup easier.
Recommended Directory structure:
~/monitoring/
├── alertmanager/
│   ├── bin/
│   │   ├── alertmanager
│   │   └── amtool
│   ├── config/
│   │   └── alertmanager.yml
│   └── alertmanager.log
│
├── prometheus/
│   ├── bin/
│   │   ├── prometheus
│   │   └── promtool
│   ├── prometheus.yml
│   ├── rules/
│   │   └── custom_rules.yml
│ └── prometheus.log- Download the release and unpack it:
cd ~/monitoring wget https://github.com/prometheus/alertmanager/releases/download/v0.27.0/alertmanager-0.27.0.linux-amd64.tar.gz tar xzf alertmanager-0.27.0.linux-amd64.tar.gz mv alertmanager-0.27.0.linux-amd64 alertmanager - Verify the binaries are in place:
ls alertmanager/bin# expect: alertmanager amtool
Why v0.27.0
It is the latest stable non-rc release with the v2 API support we need. (At the time this deep dive was written)
- Create the config folder and open the YAML:
mkdir -p ~/monitoring/alertmanager/config
nano ~/monitoring/alertmanager/config/alertmanager.yml - Paste the following, replacing
<YOUR_ID>with the ID you copied from webhook.site:
global:
  resolve_timeout: 5m

route:
  receiver: webhook-critical
  group_by: [alertname]
  routes:
    - match:
        severity: warning
      receiver: webhook-warning
    - match_re:
        team: infra|devops
      receiver: webhook-infra

receivers:
  - name: webhook-critical
    webhook_configs:
      - url: https://webhook.site/<YOUR_ID>?severity=critical

  - name: webhook-warning
    webhook_configs:
      - url: https://webhook.site/<YOUR_ID>?severity=warning

  - name: webhook-infra
    webhook_configs:
      - url: https://webhook.site/<YOUR_ID>?team=infra

inhibit_rules:
  - source_match:
      severity: critical
    target_match:
      severity: warning
equal: [alertname]- route: default to
webhook-critical, with child routes for warnings and infra alerts - group_by: batch alerts by alert name
- inhibit_rules: suppress warnings when a critical alert with the same name is firing

cd ~/monitoring/alertmanager
nohup ./bin/alertmanager \
  --config.file=./config/alertmanager.yml \
  --web.listen-address=":9093" \
> alertmanager.log 2>&1 &cd ~/monitoring/alertmanager
./bin/alertmanager \
--config.file=./config/alertmanager.yml \
--web.listen-address=":9093"pkill -HUP alertmanagerOr fully restart:
pkill alertmanager
nohup ~/monitoring/alertmanager/bin/alertmanager \
  --config.file=~/monitoring/alertmanager/config/alertmanager.yml \
  --web.listen-address=":9093" \
  > ~/monitoring/alertmanager/am.log 2>&1 &
Why both?
- Foreground is great for a quick check and real-time logs.
- Background frees your shell and persists after logout.
- SIGHUP tells Alertmanager to re-read its config, avoiding a full restart.
Verify it is running or reloaded:
ps aux | grep '[a]lertmanager'
tail -n5 alertmanager.log  # or am.log
Open the UI at http://localhost:9093/.

- Download and unpack:
cd ~/monitoring wget https://github.com/prometheus/prometheus/releases/download/v2.47.0/prometheus-2.47.0.linux-amd64.tar.gztar xzf prometheus-2.47.0.linux-amd64.tar.gzmv prometheus-2.47.0.linux-amd64 prometheus - Inspect the directory layout:
ls prometheus
# expect: prometheus promtool consoles console_libraries
6. Configure Prometheus
- Create and edit the main config:
nano ~/monitoring/prometheus/prometheus.yml - Paste:
global:
  scrape_interval: 15s

alerting:
  alertmanagers:
    - static_configs:
        - targets: ["localhost:9093"]

rule_files:
  - 'rules/custom_rules.yml'

scrape_configs:
  - job_name: 'blackhole'
    static_configs:
- targets: ['localhost:9999']- Create a rule file for a test alert:
mkdir -p ~/monitoring/prometheus/rules
nano ~/monitoring/prometheus/rules/custom_rules.yml - Paste:
groups:
- name: example
  rules:
  - alert: TestWarningAlert
    expr: vector(1)
    labels:
      severity: warning
      team: infra
    for: 0s
Why this rule?
It always evaluates true so you can immediately see a warning+infra alert in action.

cd ~/monitoring/prometheus
nohup ./prometheus --config.file=prometheus.yml > prometheus.log 2>&1 &
Verify it is running:
ps aux | grep '[p]rometheus'
tail -n5 prometheus.log
Open the UI at http://localhost:9090/.
8. Trigger and Observe Alerts
- In Prometheus UI (
/alerts), you should see TestWarningAlert firing immediately. - In Alertmanager UI (
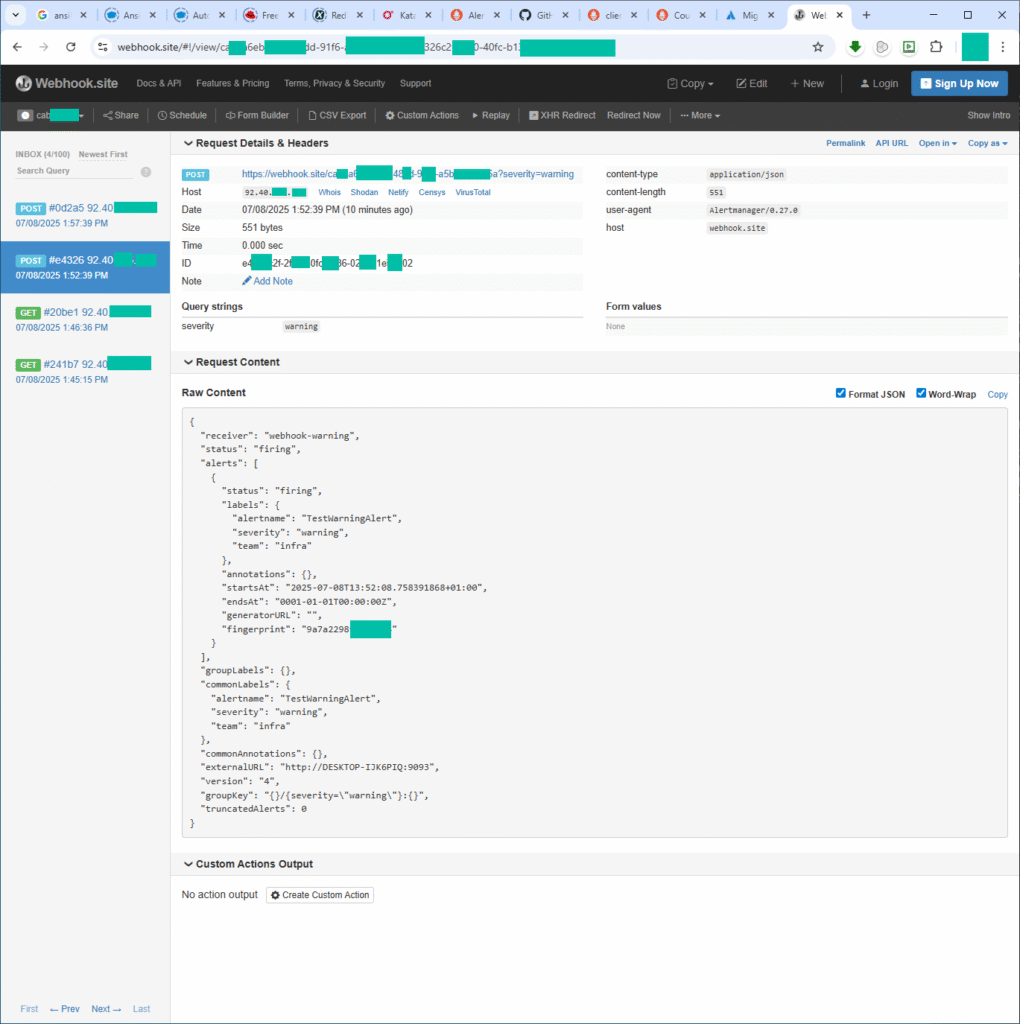
/alerts), confirm it routes under webhook-warning and webhook-infra. - In your webhook.site inbox, refresh to see two POST entries:
- One with
?severity=warning - One with
?team=infra
- One with
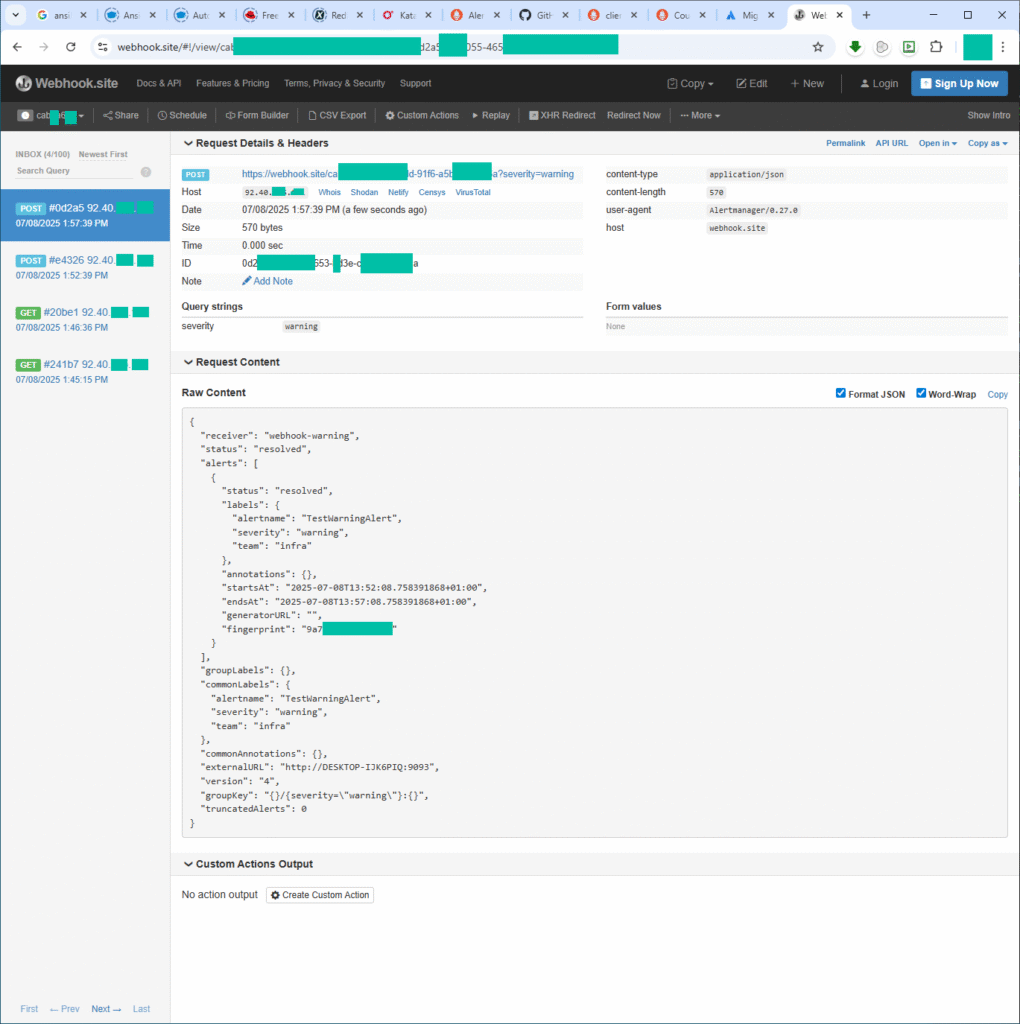
echo "groups: []" > ~/monitoring/prometheus/rules/custom_rules.yml
kill -HUP $(pgrep prometheus)
Within seconds, Alertmanager will send status: resolved payloads to each webhook.
- Prometheus UI only shows alerts it evaluates itself. Alerts posted directly to Alertmanager via
api/v2/alertsappear only in Alertmanager UI. - You can use Pushgateway to simulate a push flow that goes through Prometheus.
- OpsGenie migration: since new OpsGenie accounts require Atlassian, we used webhook.site for hands-on testing. In production, I would swap to OpsGenie or PagerDuty URLs with identical Alertmanager config.
- Alerts Not Appearing in Alertmanager
- Prometheus misconfigured
alertingblock: Ensureprometheus.ymlhas:
alerting:
  alertmanagers:
    - static_configs:
      - targets: ["localhost:9093"]
Without this, alerts won’t reach Alertmanager.
- Network issues: Confirm connectivity with:
nc -zv localhost 9093
curl http://localhost:9093/api/v1/alerts
This uncovers port, DNS, or TLS problems.
- Rules Not Loading or Firing
- Syntax errors in rules: Validate your
.ymlfiles with:
promtool check rules prometheus.rules.yml- PromQL not evaluating: Use Prometheus UI to manually test query logic.
- Alertmanager Isn’t Routing/Notifying
- No matching route/receiver: Inspect your YAML; routing and receiver labels must align. If no match, it falls back to
receiver. - Bad templates or encoding errors: Non-ASCII labels or empty template expansions can silently drop alerts. Check logs for warnings like
Message has been modified because the content was empty.
- Flapping & Duplicate Notifications
- Mismatch in evaluation intervals: If alerts trigger too quickly after resolve, increase the
for:duration (e.g., 3–4× your scrape interval) to prevent flapping. - Overlapping routing with
continue: true: This can trigger the same alert across multiple receivers; review routing logic to avoid duplicates.
- Silent Failures or “Dead” Pipelines
- No health-check alert like
DeadMansSwitch: Include a synthetic alert and monitor it. If it stops, you’ll know the pipeline is broken. - Receiver permissions or message truncation: Verify that Alertmanager has write access to notification channels (e.g., SNS policies, email authentication). Look for “invalid key/value” errors in logs.
- Performance & Scaling Concerns
- High metric cardinality: Too many labels lead to resource strain; trim unnecessary dimensions and aggregate metrics.
- Slow PromQL queries: Optimize your rules to avoid queries that fetch large time ranges or use expensive functions.
Troubleshooting Checklist
| Symptom | Quick Checks |
|---|---|
| Alerts never fire | promtool check rules, query in Prom UI |
| Prom → Alertmgr fails | nc, curl, verify alerting block |
| No notification | Examine Alertmanager logs (journalctl, debug output) |
| Messages truncated | Adjust templates and encoding |
| Flapping alerts | Add for: clause, review repeat_interval, suppress overlaps |
| Pipeline silent death | Use DeadMansSwitch, verify write permissions |
Next Steps
- Replace webhook.site with a real alerting service like OpsGenie or PagerDuty by updating
webhook_configsURLs - Add real scrape targets and meaningful alert rules for your infrastructure
- Secure Alertmanager and Prometheus endpoints behind authentication or a VPN
- Integrate silences and notification templates for richer alert context
Feel free to drop a comment or question below to share feedback or run into any issues. Happy alerting!
